
MyFoodRepo
A pilot study to test AI-supported dietary research tools
Have you ever heard about What We Eat In America? WWEIA is a regular survey run by the USDA and the U.S. Department of Health and Human Services which collects data on America’s diets on a regular basis. This is how it works: People are called randomly and are asked to recall their food over the last 24h. The problem is: humans are quite bad at accurately reporting what and how much they eat. Also, often several 24h recalls are needed to get reliable insights because, of course, our diets might differ a lot from day to day.
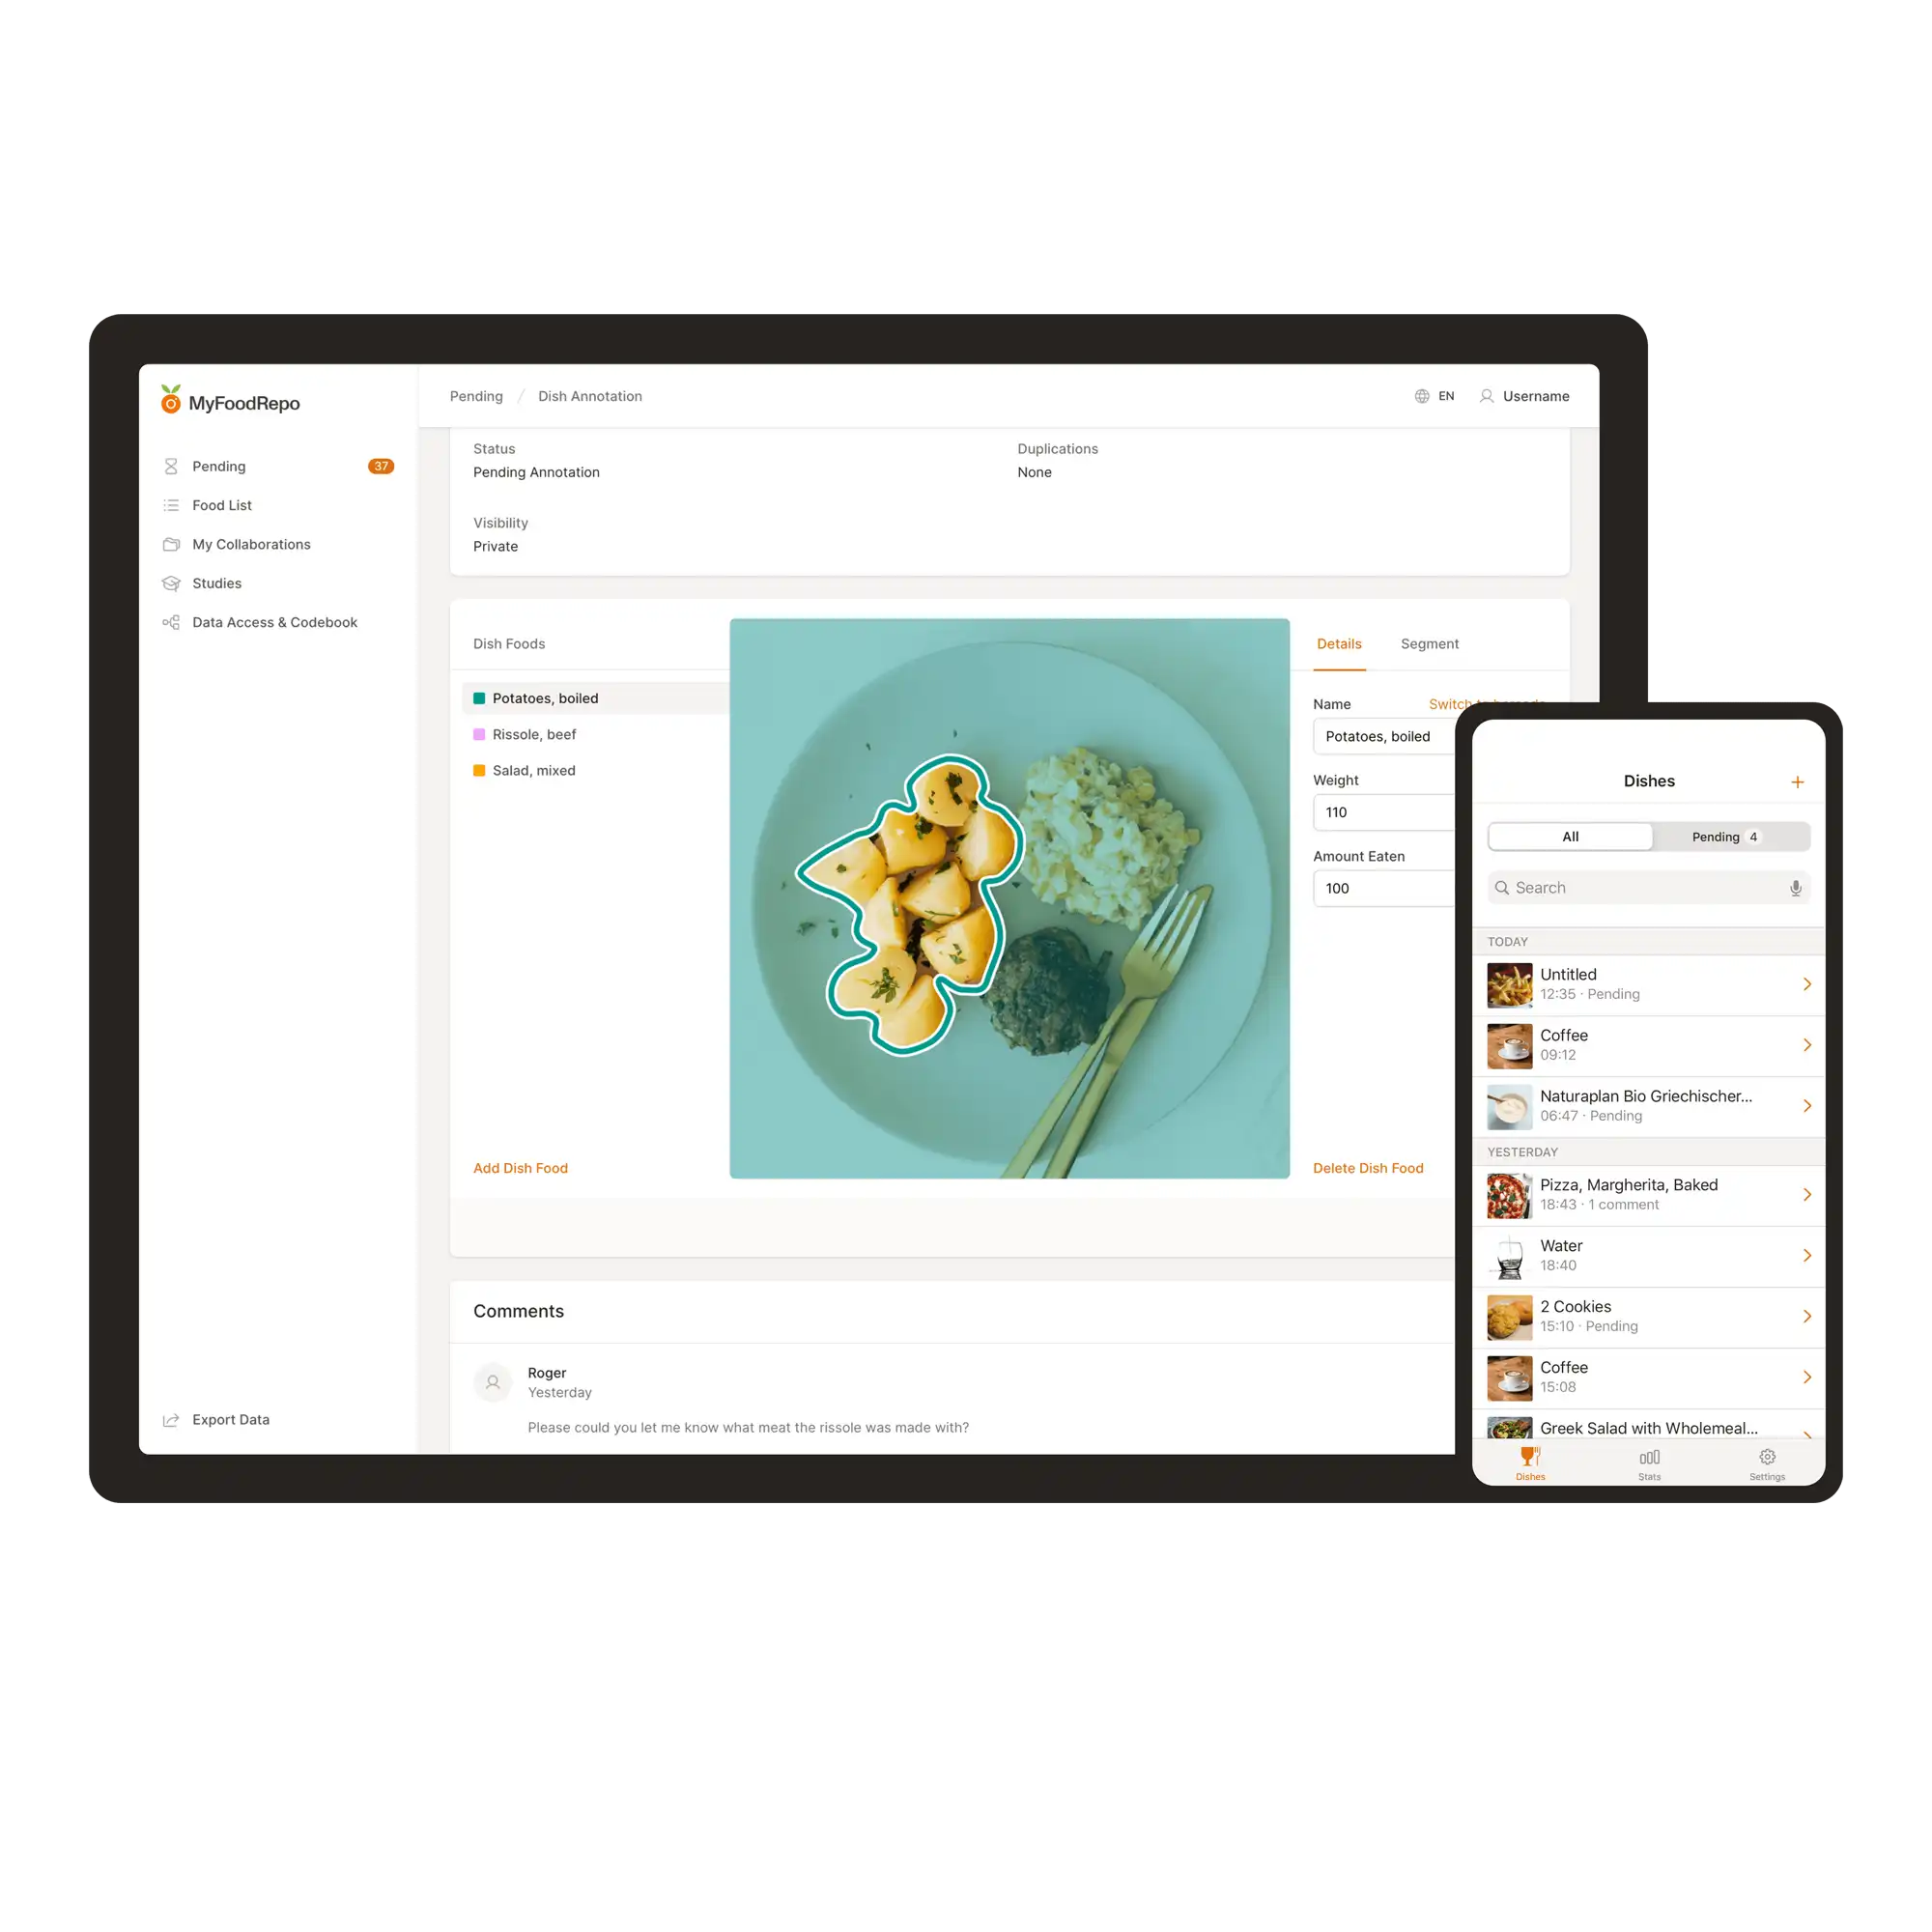
Luckily, new tools are developed that help us gain interesting insights into diets which might help overcome these challenges. For example, MyFoodRepo is an app-based research tool for nutritional researchers and professionals that can be used to understand what a group of people eats over the course of several days. Study participants are simply taking photos of their meals for one week. Their photos get analyzed by a software that categorizes eaten foods - of course with the help of a human eye.
We wanted to learn what this tool can do to gather data on local food patterns in the CMA region. Our questions: Is there a uniquely local diet? And how much do factors like location, gender, age or education influence what people eat?
To the case study
Setting up a small test study
First things first: We have not done a statistically representative study of CMA’s food patterns. Instead, we have tried and tested a research tool to learn what types of insights we can get into local diets. The goal was to understand if this tool could help local universities or health practitioners in the future to start a larger food pattern study. Our learning: Yes, MyFoodRepo could help paint a picture of the uniquely local diets of people, if applied broadly.
What did we do?
Together with Davidson College, we prepared a small-scale trial of MyFoodRepo. We recruited 11 volunteers, aged between 19 and 40 years to take photos of their meals over one week. Then, with the support of trained student volunteers, the photos were analyzed, using the software MyFoodRepo. The 200 tracked meals are of course not a full picture of local diets - but we learned what type of information we can gather from this data.


First results
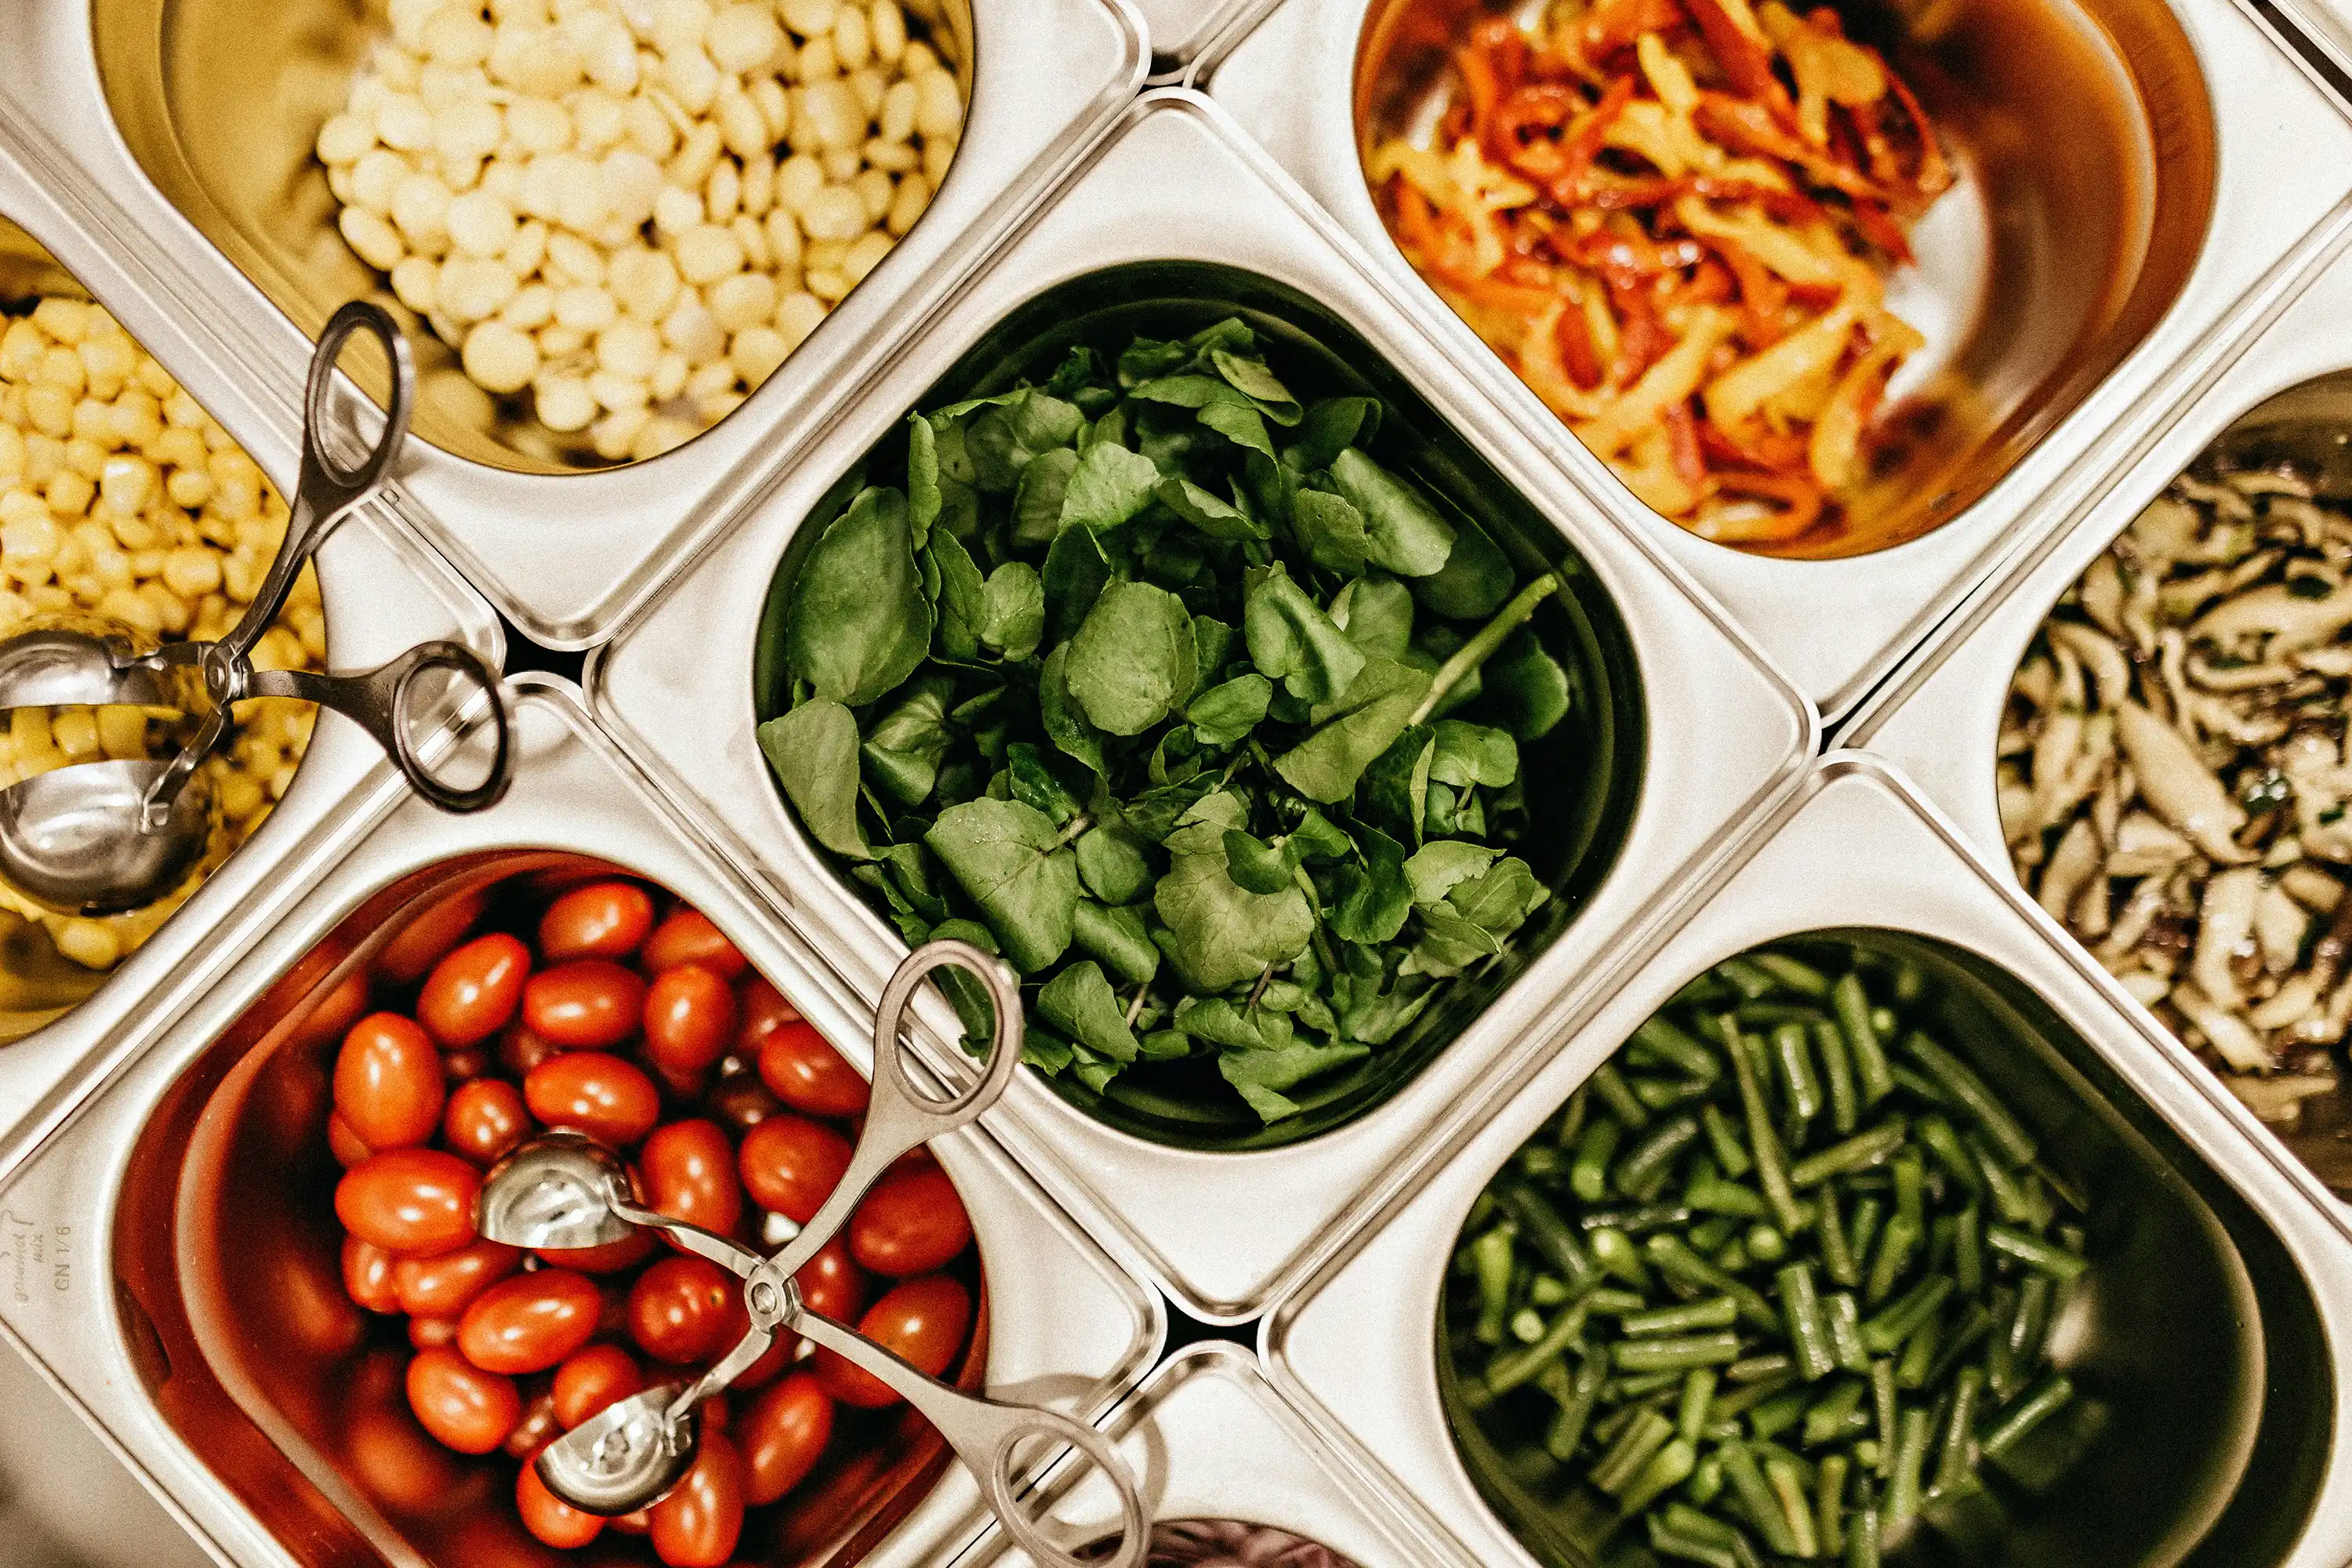
MyFoodRepo allows us to collect data on the most common food groups consumed by weight or by calories.
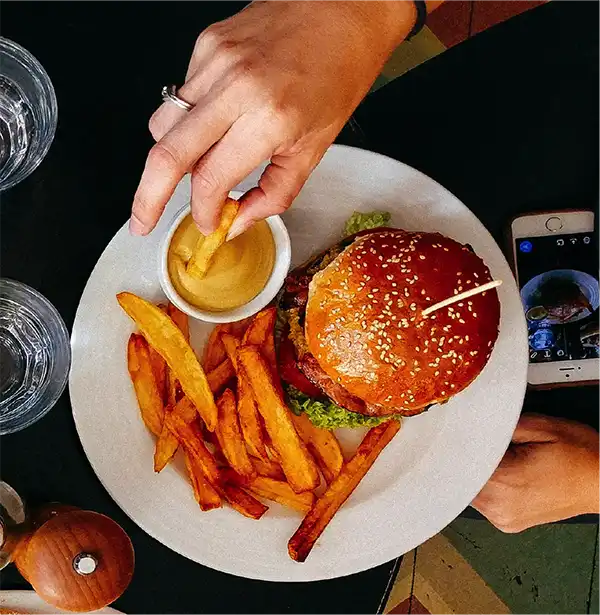
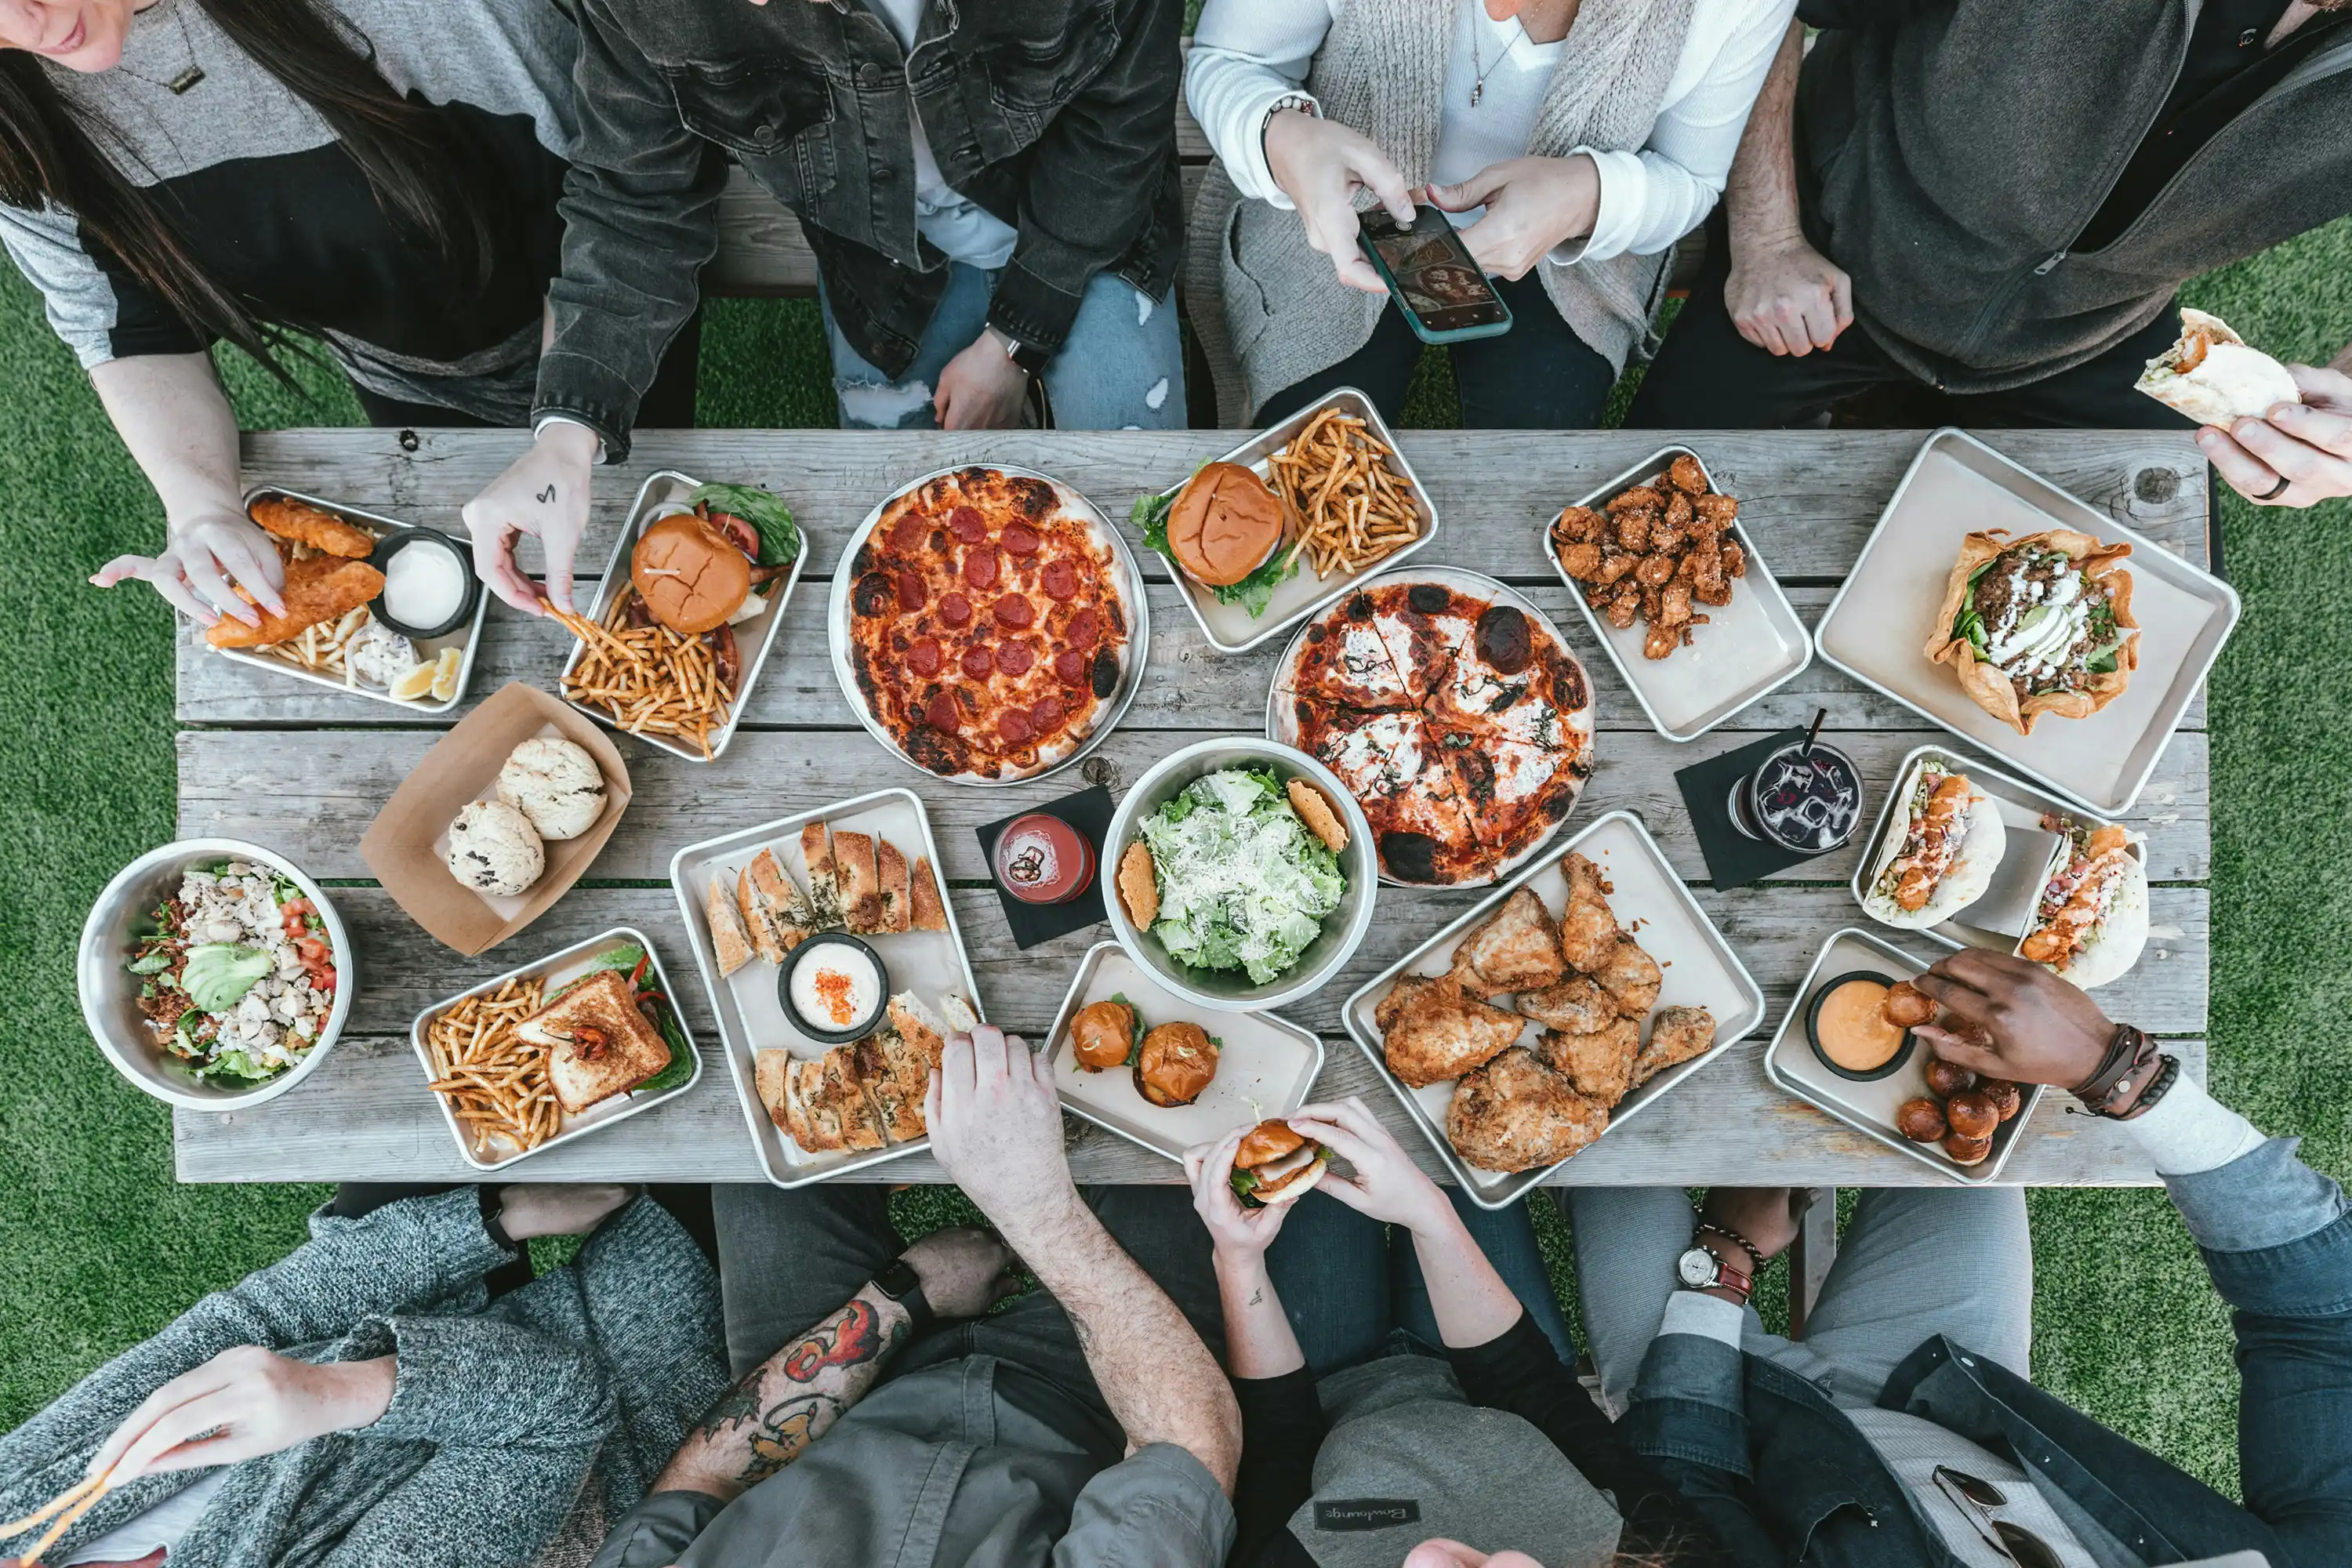
In our trial study, we can see that our participants consumed most calories from ultra-processed foods, such as pizza, sandwiches and burgers, followed by grains.


First results
Using MyFoodRepo in a local nutrition study could also show us what a typical breakfast, lunch or dinner in CMA looks like. For example, it could show which food groups are usually consumed in different meal types. If done correctly, we could learn whether gender, socioeconomic status, race, age or living location affect our food patterns. Of course, our study was too small to make these conclusions - but there is a lot of potential for further research.
What could be next?
Replicating this study at a larger scale is promising and could fill knowledge gaps on nutrition and nutritional inequality across communities.
But the format has limitations. For example, it is not suited to study what food children and youth are eating.
To study childhood nutrition in the CMA, schools are a great starting point.