The Story of the Charlotte Metro Area Food System
Discover how food threads the lives and landscapes of the Charlotte Metro Area: from farm to market to you
PART 1
The food system starts at the farm.
PART 1
16,818 producers work on farms in the Charlotte Metro Area.
PART 1
What do we know about the producers in the Charlotte Metro Area?

Farming and race

Farm workers who are involved in decision-making on the farm are called "producers". They can be owners, family members of owners or hired farm managers. A look at the racial composition of producers gives us an important insight:

Even today, farming is not blind to race and remains a white-dominated profession. White people account for 43% of the population in the Charlotte Metro Area, but make up 95% of the region’s producers. At the same time, while  35% of CMA population is Black or African American, only 2% of producers identify as such.

The underrepresentation of Black and African American, Hispanic, Asian and American Indian communities in farming is not the only difference. White farmers were also found to own larger and more profitable farms than Black farmers.

16,818
Total producers

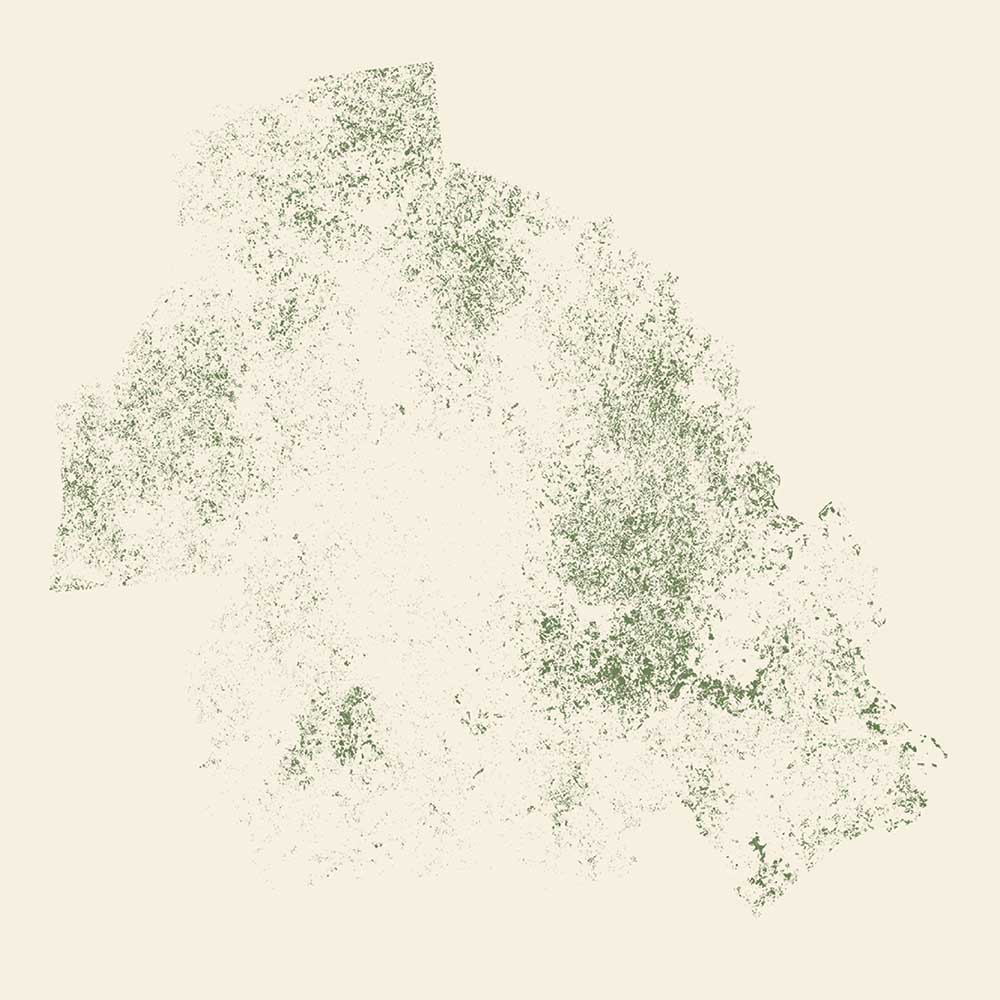
Select a race to see its distribution on the map

To read more on women in US Agriculture, this paper is a good place to start

Farming and gender

Farming is not blind to gender, neither. The profession was and remains male-dominated, due to a complex interplay of social, historical and cultural factors. Historically, it was only men who could inherit farm land, excluding women from land ownership. While this has changed, women are still underrepresented as producers in agriculture. Of all producers in the CMA, only 35% are female.

PART 1
Crops and livestock -
What do farms in the Charlotte Metro Area produce?
We derived the Charlotte cropland map for 2022 from the USDA cropland data layer, a 30-meter resolution land use map of the United States.

Crops

Most of the farmland in CMA is used to grow animal feed. Only four crops account for 90% of the total volume harvested. These crops include hay, corn, soybeans, and wheat.

Crops

The top agricultural-producing counties are Union and Iredell. Together they account for 42% of all crops grown in the Charlotte Metro Area.

Why is our food system so specialized around so few crops?
We calculated fruit and vegetable production in and around Charlotte on the basis of production area estimates derived from the USDA 2022 cropland data layer and state (where available) or national average crop productivity data.

Our estimates of the total area of fruit and vegetable production in and around Charlotte are probably affected by a bias in the classification of pixels into specific crops. This bias is inherent in the approach used to construct the USDA cropland data layer, i.e. automated classification of satellite imagery.

Fruits and vegetables

Peaches make up 61% of all fresh fruit and vegetables grown in farms in the Charlotte Metro Area.

Fruits and vegetables

There are over 20 different types of fresh fruits and vegetables growing in the CMA region. Chesterfield County is the largest producer, growing 54% of fruits and vegetables in the CMA. Peach cultivation makes up 88% of the county's fruit and vegetable harvest.

We constructed this map using 2015 UN Food and Agriculture Organization (FAO) data. It will be updated when more up-to-date data becomes available. The locations of Animal Feeding Operation (AFO) are from 2022 and suggest that an updated poultry distribution map may look different.

Poultry

In the CMA region, chicken and turkeys are raised to produce 368 US ktons of poultry and 25 US ktons of eggs per year.

Not all of these animals are raised under the same conditions. Many animals are raised indoors in closed facilities called animal feeding operations (AFOs). The dots on the map show AFOs raising poultry. 

Some AFOs are so big that they are distinguished from smaller facilities. Big AFOs contain at least 30,000 to 100,000 laying hens. Therefore, the USDA calls these facilities CAFOs (concentrated animal feeding operations). Every day, CAFOs accumulate manure in high quantities, often with residues of antibiotics and other drugs. The discharge of this manure can be a big problem for aquatic and human health. Amongst the four poultry AFOs in the CMA area, there is only one facility that classifies as a CAFO.

Poultry

Anson, Union, and Alexander are the counties that take the lead here, together accounting for 64% of poultry and egg production.

What is the problem with (concentrated) animal feeding operations?
We constructed this map using 2015 UN Food and Agriculture Organization (FAO) data. It will be updated when more up-to-date data becomes available. The locations of Animal Feeding Operation (AFO) are from 2022 and suggests that an updated cattle distribution map should look similar.

Cattle

In the US, the cattle industry is divided into beef and dairy production. In the CMA, the vast majority of cattle farms produce milk and dairy products.

A lot of dairy and beef cows are held in small and large animal feeding operations that concentrate in the northern counties of the CMA. Yet, the majority of these facilities are not classified as CAFOs (concentrated animal feeding operations).

For cattle, CAFOs are animal feeding operations that keep at least 1,000 cattle for beef production or 700 dairy cows. In the CMA, there are three facilities allowed to keep over 700 dairy heifers or milk cows. All of these facilities are found in Iredell.

Another large facility holding cattle for beef production in Lincoln does not make the cut of a CAFO with a limit of 900 cows. However, depending on other conditions, such as the waste treatment methods, even smaller animal feeding operations under these thresholds can be considered as CAFOs.

Cattle

The biggest cattle farming county by far is Iredell, accounting for 58% of total beef and milk production.

We constructed this map using 2015 UN Food and Agriculture Organization (FAO) data. It will be updated when more up-to-date data becomes available. The locations of Animal Feeding Operation (AFO) are from 2022 and suggests that an updated pig distribution map should look similar.

Swine

In the Charlotte Metro Area, the swine industry produces 24 US ktons of pork every year. Nearly all the pork is produced in Anson.

Facilities that hold over 2,500 grown pigs over 55 pounds or 10,000 pigs under 55 pounds are considered large CAFOs. Two of the AFOs in CMA have permits to over raise 2,500 pigs all the way up to a finishing weight of 270-285 pounds. Therefore, these facilities would classify as large CAFOs.

PART 1
The agricultural landscape of the Charlotte Metro Area has changed over the past 100 years.
PART 1
Many smaller family farms are disappearing
PART 1
Yet, the average farm size has increased from 74 to 184 acres within one century.
PART 1
Today, we have fewer but bigger farms. 
USDA, Census of Agriculture 2022

A 1-million-acre patchwork of farms

Over time, farms in the Charlotte Metro Area have grown, while the total amount of farmland has remained steady at about 1 million acres. In short, that means fewer but larger farms.

Average farm size varies significantly between counties. At 240 acres, Union County boasts the biggest average farm size. Mecklenburg County, a largely urban area, has the smallest average farm size: 47 acres.

Go big or get out - linking established government policies as resources
This list may not be complete. Data was collected through research of farms with an online presence.

Mapping small farms in the Charlotte Metro Area

Farms across the entire country are facing immense economic, climatic and social challenges. But one type of farm is hit hardest: the small family farm. Defined by an acreage of under 179, small farms operated by family businesses made up 89% of America’s farms in 2022. But in the same year they only account for 18% of agriculture's total market value. Fierce competition with factory-sized farms and dumping prices for commodity crops make it difficult to stay afloat as a small farmer. Many rely on other jobs to supplement their income. 

And this is a problem! Small family farms all across the country are important for keeping jobs local. They also increase food security while protecting the local environment. Small farms tend to grow a higher crop diversity which makes our food system more resilient. They also tend to adopt more regenerative practices, benefiting local soils and biodiversity.

This is why we want to highlight CMA’s small farms, raising animals and growing local produce which largely ends up on plates in our community. Since there is no public registry of small farms, we started identifying over 500 farm locations which you can see on this map.

We calculated the degree of farmland area change by analyzing geospatial data.

Cropland change

Over the past years, farmland in the CMA region is changing. While the total area of farmland remained stable at around 1 million acres, it is the type of farmland that is changing.

Cropland used to cultivate crops, such as gains, vegetables or fruit, is declining in almost all counties of the CMA.

What is happening to local cropland? One explanation lies in the rapid development of sprawling residential areas that pave over cultivated cropland.

But why did we not see a reduction in total farmland? Scroll down to find out.

We used geospatial data to calculate the encroachment of farmland onto natural areas.

Pastureland change

While cropland is declining, most counties experienced a growth in land used for pastures. Most notably, pastureland has increased in Union, Iredell, Catawba and Cleveland. Remember, Iredell is home to most cattle farms of the entire CMA region.

Some fields that once were used for crop cultivation may have been converted to pastures.
But most likely, pastures have been carved out from forests or other green areas which have not been under agricultural production before.

This might explain why overall farmland (cropland and pastureland together) has been stable.

We used geospatial data to calculate the encroachment of farmland onto natural areas.

From forests to pastures

Most likely, the growth in pastureland can be explained by conversion of natural ecosystems such as forests and shrubland. We can see this concerning trend throughout the CMA. But most nature loss is happening in the counties of Chesterfield, Lancaster and York.

The graphics below show what type of nature has been lost to the expansion of pastureland. Deciduous and evergreen forests experienced the largest loss between 2017 and 2022.

PART 1
The way producers manage farmland is different from one farm to the next.
PART 1
Some farming practices try to minimize the impact on land, soil, biodiversity and water.
PART 1
How widely spread are these practices in the Charlotte Metro Area? 
USDA, Census of Agriculture 2022

Intensive agriculture practices are the norm

Tillage is an intensive farming practice. The goal is to prepare the ground for farming by digging, stirring or overturning the soil.

Intentionally foregoing tillage (no-till) is a regenerative practice. It preserves the health and natural balance of the soil better.
Cover cropping is a regenerative practice. Cover crops are plants whose main purpose is not to be sold and consumed (although they may still be). Rather, they are a natural way of protecting and improving the soil.


The Census of Agriculture regularly collects data on farming practices adopted by producers in each county. This information reveals how many farms are using environmentally friendly practices, such as refraining from tilling the soil or growing cover crops. 

Explore the map on the right to discover how many farms in the CMA region apply these practices.

You may notice that no-till farming and planting cover crops are not yet widely adopted in most counties. Most farms rely on intensive practices, such as using chemical fertilizers and heavy machinery, to boost yields and control pests.

What is the difference between conventional, organic and regenerative farming?
PART 1
Farming depends on natural resources, such as healthy soils, clean water, and intact ecosystems.
PART 1
What is the current state of these natural resources needed for farming?
Everything begins with water. But while we're often focused on its availability, there are also other factors to take into account. We don't just need enough water; we need enough clean water, at the right pH and temperature. Let's take a look at water in the CMA region.
Data are not presented for two sub-basins: Lower Broad and Wateree, as no similar report was found for South Carolina.

We mapped the water temperature status in Charlotte's Basin with the latest impaired water assessment performed by the North Carolina Environmental Quality Agency in 2022.

We mapped the water pH status in Charlotte's Basin with the latest impaired water assessment performed by the North Carolina Environmental Quality Agency in 2022.

We mapped the water turbidity status in Charlotte's Basin with the latest impaired water assessment performed by the North Carolina Environmental Quality Agency in 2022.

We mapped the water contamination (E.coli) levels in Charlotte's Basin with the latest impaired water assessment performed by the North Carolina Environmental Quality Agency in 2022.

Water pollution in the Charlotte Metro Area

Watersheds are areas of land that drain into particular water bodies, such as lakes or river mouths. The Charlotte Metro Area is divided into 10 watersheds.

The water quality in the CMA region is influenced by so many decisions we make, from how we organize our cities to how we farm our land.

Water temperature is very important for the kinds of creatures that live in rivers and lakes. Different animals like fish, insects, and plankton have their own favorite temperature ranges. Intensive farming and climate change both impact water temperature. Farming can erode soil into streams, making the water murky and warmer. It's also a major contributor to climate change, which is making water temperatures rise worldwide.
The pH level tells us how acidic or basic the water is. It's an important parameter when it comes to checking how healthy a body of water is because changes in pH can signal problems like acid rain or pollution. Basically, anything that touches the water—chemicals, minerals, pollutants, soil, litter, you name it—can mess with its pH. When water gets too acidic, it affects the whole aquatic ecosystem and can even kill off entire species. Heavy use of agricultural chemicals, like herbicides, fungicides, and insecticides, has been shown to directly impact the water’s pH.
Turbidity indicates the concentration of matter (e.g. plankton, sediment) in water. Heavily paved surfaces, such as cities and roads  - contribute to the runoff of dust, dirt, and litter, especially during storm surges. Intensive farming methods, especially plowing and tilling, also make soil more prone to erosion. When soil washes away into the water, it ramps up the turbidity levels. This high turbidity is bad news—it's a form of water pollution that affects aquatic life and cranks up the water temperature.
The presence of E. coli in water signals contamination from sewage or animal waste, which can contain harmful organisms. Intensive livestock farming systems that do not properly manage their waste, as well as wastewater carried out of the sewer system by storm surges, are major risk factors for contamination.
Exposure to contaminated water can make you sick.

That's why the North Carolina Department of Health and Human Services keeps a close eye on E. coli levels in Charlotte's water.
Soil is one of the most precious resources we have. One teaspoon of soil contains more living organisms than there are people in the world. Without soil, life on Earth would simply not be possible. And it's not something we can replenish or recreate easily: an inch of topsoil can take a thousand years to form. Plenty of reasons to take good care of our "dirt" then. Human activities, like industrial agriculture can erode our soil, or bring it out of balance. Let's take a closer look at these soil degradation processes and how they play out in Charlotte.
Data was derived from the N.C. Department of Agriculture and Consumer Services, Agronomic Division

Losing CMA’s most precious resource

Soil erosion refers to the process by which soil is gradually worn away or displaced by natural forces like water or wind. It's a natural process, but it can be accelerated by human activity, including agriculture. Erosion causes the fertile top layer of the soil to be lost, leading to soil degradation. We don't know exactly how much soil erosion is taking place in the CMA, but we do have an idea of how vulnerable our soils are. This vulnerability (here called wind erodibility) is visualized in the map on the right-hand side.

Phosphorus levels in Charlotte and the surrounding area are only available for counties in North Carolina.

Soil health data is collected at different locations each year, so we are unable to make a direct connection between particular agricultural practices in and around Charlotte to impacts on the soil.

The pollution of soils

Pollution is another way in which soils degrade over time. Indeed, much of the soils in the CMA are out of balance, containing an excessive amount of phosphorus, a mineral commonly found in chemical fertilizers.

pH levels in Charlotte and its surrounding area are only available for counties in North Carolina.

Soil health data is collected at different locations each year, so we are unable to make a direct connection between particular agricultural practices in and around Charlotte to impacts on the soil.

Data source:  N.C. Department of Agriculture and Consumer Services, Agronomic Division

Degrading land

A third degradation process that threatens the health of our soils is acidity imbalance. Recent sampling revealed that soils in the Charlotte Metro Area can sometimes be too acidic, which disrupts essential processes within the soil and in turn decreases its fertility.

Acidity levels are linked to agriculture. To reach the perfect soil acidity levels for crops, farmers apply lime, a powdery compound containing calcium. It’s a widely used practice, common across all different types of farms, but it’s a tricky balance to strike as the map to the right shows.

You can think of biodiversity as the riches of nature. It indicates both the abundance of plants, animals, ecosystems and species on our planet, as well as the diversity between them. The more abundant and diverse, the healthier, more resilient, and frankly, beautiful, our world is.

The bad news is that our planet's biodiversity has been in rapid decline. Species are disappearing at a staggering, and unprecedented rate. Human activities, including industrial agricultural practices, are a major driver of global biodiversity loss. Let's have a look at the state of biodiversity in the Charlotte Metro Area.
Data are not presented for two sub-basins: Lower Broad and Wateree, as no similar report was found for South Carolina.

We mapped the water quality status with regards to aquatic habitat in Charlotte's Basin with the latest impaired water assessment performed by the North Carolina Environmental Quality Agency in 2022.

Keeping CMA's waters a welcoming home

This map shows the water quality in different areas across CMA. Biologists from the North Carolina Department of Environmental Quality checked diversity, abundance, and sensitivity to pollution of the creatures living in CMA’s waters to figure this out. The verdict was simple but alarming: the current water quality in the Charlotte Metro Area is threatening aquatic biodiversity.

Keeping a variety of aquatic life is important for the environment and us. Even though we might not think about it much, every type of water creature helps keep our world healthy and productive. Studying these creatures can even help us find new medicines or ways to deal with climate change. Plus, we want to leave behind a world full of diversity and abundance for future generations to enjoy.

Did we miss your farm? We use USDA data, which only includes farms over 10 acres.

Biodiversity in the Charlotte Metro Area

Our planet's dramatic decline in biodiversity is being closely monitored. The map on the right provides an overview of the diversity and abundance of species in the CMA region, reflected in the Biodiversity Intactness Score. 

Rather than only monitoring biodiversity loss, it would be even better to halt or reverse it. However, urbanization, the primary driver of species decline, is occurring worldwide, including in the CMA. This is why Mecklenburg County, the most urbanized part of the Charlotte Metro Area, has the lowest biodiversity intactness score. 

Farming also contributes to biodiversity loss, particularly intensive farming, where vast fields are dedicated to a single crop. If you look at the map, you'll notice low intactness levels in southern Chesterfield County, where natural land has been converted to farmland, putting additional pressure on biodiversity.

The Charlotte Metro Area's food system from a global perspective

Today's food systems are complex and globally intertwined. Food found on supermarket shelves has often traveled thousands of miles. At the same time, locally produced crops and products is exported all over the country and the world.

The graphic on the right allows you to explore the trade flows of food between the Charlotte Metro Area and other national and global regions. Click on one regions and see which products are imported from and exported to this region, using the chart below.

Help Ray till his land

Ray needs your help with tilling his farm land. Are you up for the challenge? Use the up-key on your keyboard to make sure Ray doesn't collide with any objects and destroy his tractor while he is tilling the land. If you get Ray far enough he might reward you!

Food infrastructure in and around Charlotte

Any agricultural product relies on proper storage, processing, and swift transportation to be successfully brought to market. The big agricultural players have crafted an intricate web of logistics that spans the globe. Smaller farms can't tap into this system and instead have to rely on local intermediaries for processing and distribution. The map on the right is part of an ongoing effort to give an overview of the logistical solutions that North Carolina's smaller producers have access to.